The app list
The first question is whether your app is up. The app list answers it for every environment your kubeconfig reaches, without you picking a resource kind first.
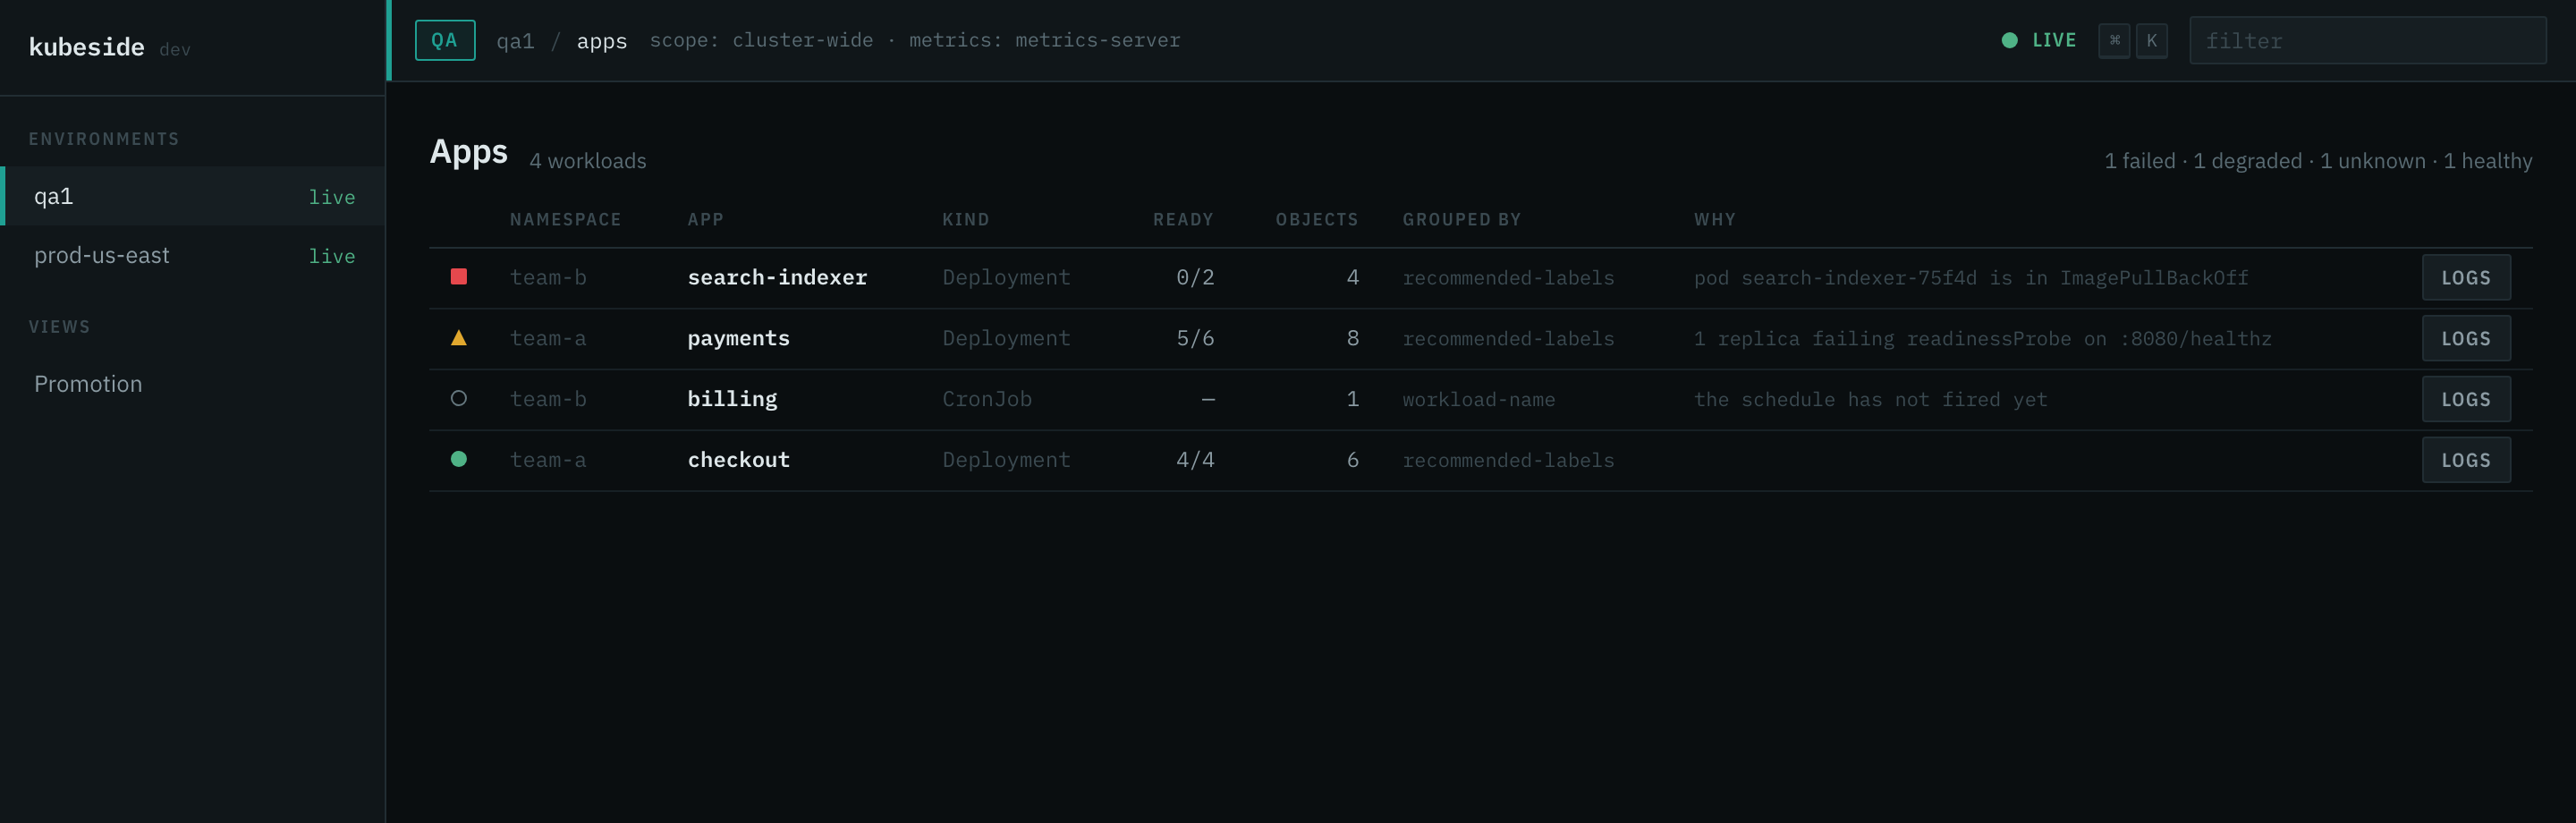
What an app is
Kubernetes has no application object. kubeside builds one by walking controller owner references from every object up to its top-level workload, then naming that workload by the first rule that matches:
| Order | Rule | Shown as |
|---|---|---|
| 1 | app.kubernetes.io/instance, then app.kubernetes.io/name |
recommended-labels |
| 2 | meta.helm.sh/release-name annotation |
helm-release |
| 3 | argocd.argoproj.io/instance label |
argocd-instance |
| 4 | The workload's own name | workload-name |
Hover an app name to see which rule produced that row and how many objects it
covers, so a list that looks wrong tells you why it looks wrong. kubeside --print puts the same thing in a GROUPED BY column, which is the faster way
to audit a whole cluster at once: a cluster full of workload-name is a cluster
whose labels carry no information, and that is worth knowing.
A workload owned by something kubeside does not model, an operator's custom
resource for example, is marked Kind via Owner rather than hidden. It might
still be somebody's app.
What a row carries
| Column | Reads |
|---|---|
READY |
Ready replicas over desired, or — for a kind where that means nothing. |
TAG |
The image tag the workload asks for. Hover it for the full reference, because two apps on 1.4.2 from different registries are not the same code. |
AGE |
How long since this revision appeared, measured from the newest object the rollout created. Not how long the app has existed. |
RESTARTS |
Container restarts across the app's pods, amber above zero. |
WHY |
What derived the health, and nothing at all when the app is healthy. |
RESTARTS counts the lifetime of the pods that are running now, not a 24-hour
window. Kubernetes does not publish a windowed count, and a rolling deploy
resets the number by replacing the pods. Treat it as "is this flapping right
now", and open the timeline for restarts over time.
A row with no pods reads — rather than 0. A CronJob that has never fired has
restarted zero times only in the sense that nothing has run.
Health
Health is derived, and the row says what derived it:
| Glyph | Health | Example reason |
|---|---|---|
| ■ | failed | pod search-indexer-75f4d is in ImagePullBackOff |
| ▲ | degraded | 1 replica failing readinessProbe on :8080/healthz |
| ◇ | progressing | a rollout is in flight |
| ○ | unknown | the schedule has not fired yet |
| ● | healthy | ready equals desired |
Worst first: the two apps that need a human sit above the forty that do not.
A CronJob with no run yet is unknown, not healthy and not failed. Reading
"nothing has happened" as "everything is fine" is exactly the mistake this
column exists to avoid.
Metrics
CPU and memory come from metrics-server when it is installed, and from nothing
when it is not. Prometheus is named in the config file and is not implemented
yet. Usage is summed across the app's pods, in the same millicores kubectl top
prints, so the two screens agree.
When no source answers, the columns disappear and the header says why:
metrics: unavailable · metrics-server is not installed (metrics.k8s.io is not registered)
A zero would be a reading nobody took.
A number followed by * is built from fewer pods than the app has. Hover it for
the count. A crash-looping replica reports nothing, so its app's total is the
usage of the replicas still standing, and saying so is the difference between a
number and a number you can act on.
Partial reads
If a kind could not be listed, it is named:
partial: CronJob
That is the difference between "this cluster has no CronJobs" and "your role cannot list CronJobs here". Only one of those is a fact about the cluster.